How NOT to benchmark your transferability estimation metric
Source Independent Transferability Estimation (SITE) metrics have become a hot topic in AI research. The goal is simple: pick the best pre-trained model for a target task without the cost of fine-tuning or needing access to the original source data. Our recent paper accepted at ICLR 2026 reveals a troubling reality: the benchmarks we use to measure progress in this field are fundamentally flawed.
🚩 Issues with the “Standard” Benchmark
We’ve noticed that most metrics are tested on a model zoo dominated by ResNets, DenseNets and MobileNets. When we looked closer at the data, three major red flags stood out:
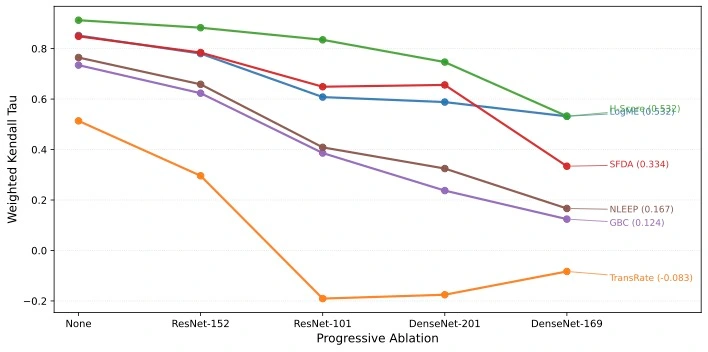
- We aren’t testing models; we’re testing model size: In the real world, we aren’t just choosing between a big ResNet and a small one. But in current benchmarks, larger models predictably win almost every time. When researchers removed the largest models from the overrepresented families, we saw the performance of these SITE metrics absolutely crater. They simply couldn’t tell the difference between two models of similar size. We validate this with ablating one model at a time and see the performance change of SITE metrics. We see that with a reduced search space, the metrics lose performance, which is counterintuitive.
- The “Static Ranker” is beating standard benchmark : This is the most interesting part: we could “solve” most current benchmarks without looking at the target data at all. By using a Static Ranking Heuristic, just a pre-defined list ordered by model size, we can outperform every proposed metric listed. The stats: This “static” ranker hit a correlation of 0.91, while one of the most popular SITE metrics, LogME, only managed 0.57. If a static list beats SITE metrics, standard benchmark isn’t testing transferability; it’s testing for a bias on static lists.
![]()
- Lack of fidelity: If we use a metric and it tells us Model A is “10 points better” than Model B, we expect a significant accuracy gain. However, we’ve found that current metrics have a very weak correlation with actual accuracy differences (\(\Delta_{Acc}\)). A huge score gap might mean a 2% jump, or it might mean nothing at all. We show the verification of this approach by studying correlation between the changes in score and accuracy per metric per dataset.
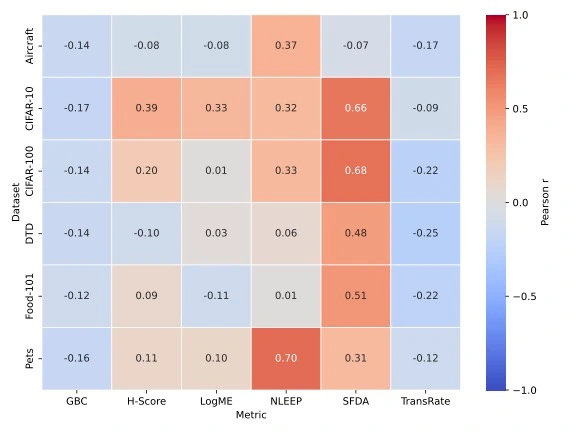
| Dataset / Metric | Aircraft | CIFAR10 | CIFAR100 | DTD | Food | Pets | Average |
|---|---|---|---|---|---|---|---|
| GBC | -0.12 | -0.02 | 0.09 | 0.14 | 0.10 | -0.15 | 0.007 |
| TransRate | 0.14 | 0.51 | 0.20 | 0.20 | -0.05 | 0.17 | 0.195 |
| SFDA | -0.22 | 0.85 | 0.79 | 0.63 | 0.30 | 0.34 | 0.448 |
| H-Score | 0.60 | 0.91 | 0.80 | 0.04 | 0.59 | 0.37 | 0.552 |
| NLEEP | -0.51 | 0.76 | 0.84 | 0.70 | 0.69 | 0.84 | 0.553 |
| LogME | 0.41 | 0.85 | 0.72 | 0.66 | 0.39 | 0.41 | 0.573 |
| Static Ranking | 0.84 | 0.91 | 0.98 | 0.99 | 0.80 | 0.94 | 0.91 |
SITE Benchmark and Evaluation Checklist
To apply our learnings from this study we devise a checklist for evaluating SITE Metrics fairly.
Best practices for Building a Benchmark
Best practices for Reporting Experiments and Evaluation
Best practices for Releasing Code
For all experiments you report, check if you released: